For our first topic for #Viz2educate we chose the subject of Geography. We asked you to create visualizations not only to aid teachers across the globe but to inspire their students, and we’ve been overwhelmed by the incredible submissions we’ve received this month from the #datafam community!
In total, we received 23 submissions for Geography, and of these 3 have received VOTDs! We would like to take this opportunity to give some special shoutouts to Kevin Flerlage, Mateusz Karmalski and Will Sutton, who have each submitted more than one viz for this month!
Of the members of the #datafam who submitted this month, 7% worked within the field of education – going forwards we would love to encourage more teachers and educators to contribute towards the project. Despite us only being on the first month of the project we are really proud to say that 5 individual teachers across 3 schools in India have reached out to us directly to inform us that they have been using our resources successfully in their classrooms – this means that we have reached over 200 students. We hope going forwards we will see more teachers and students benefitting from #Viz2educate.
Viz Highlights
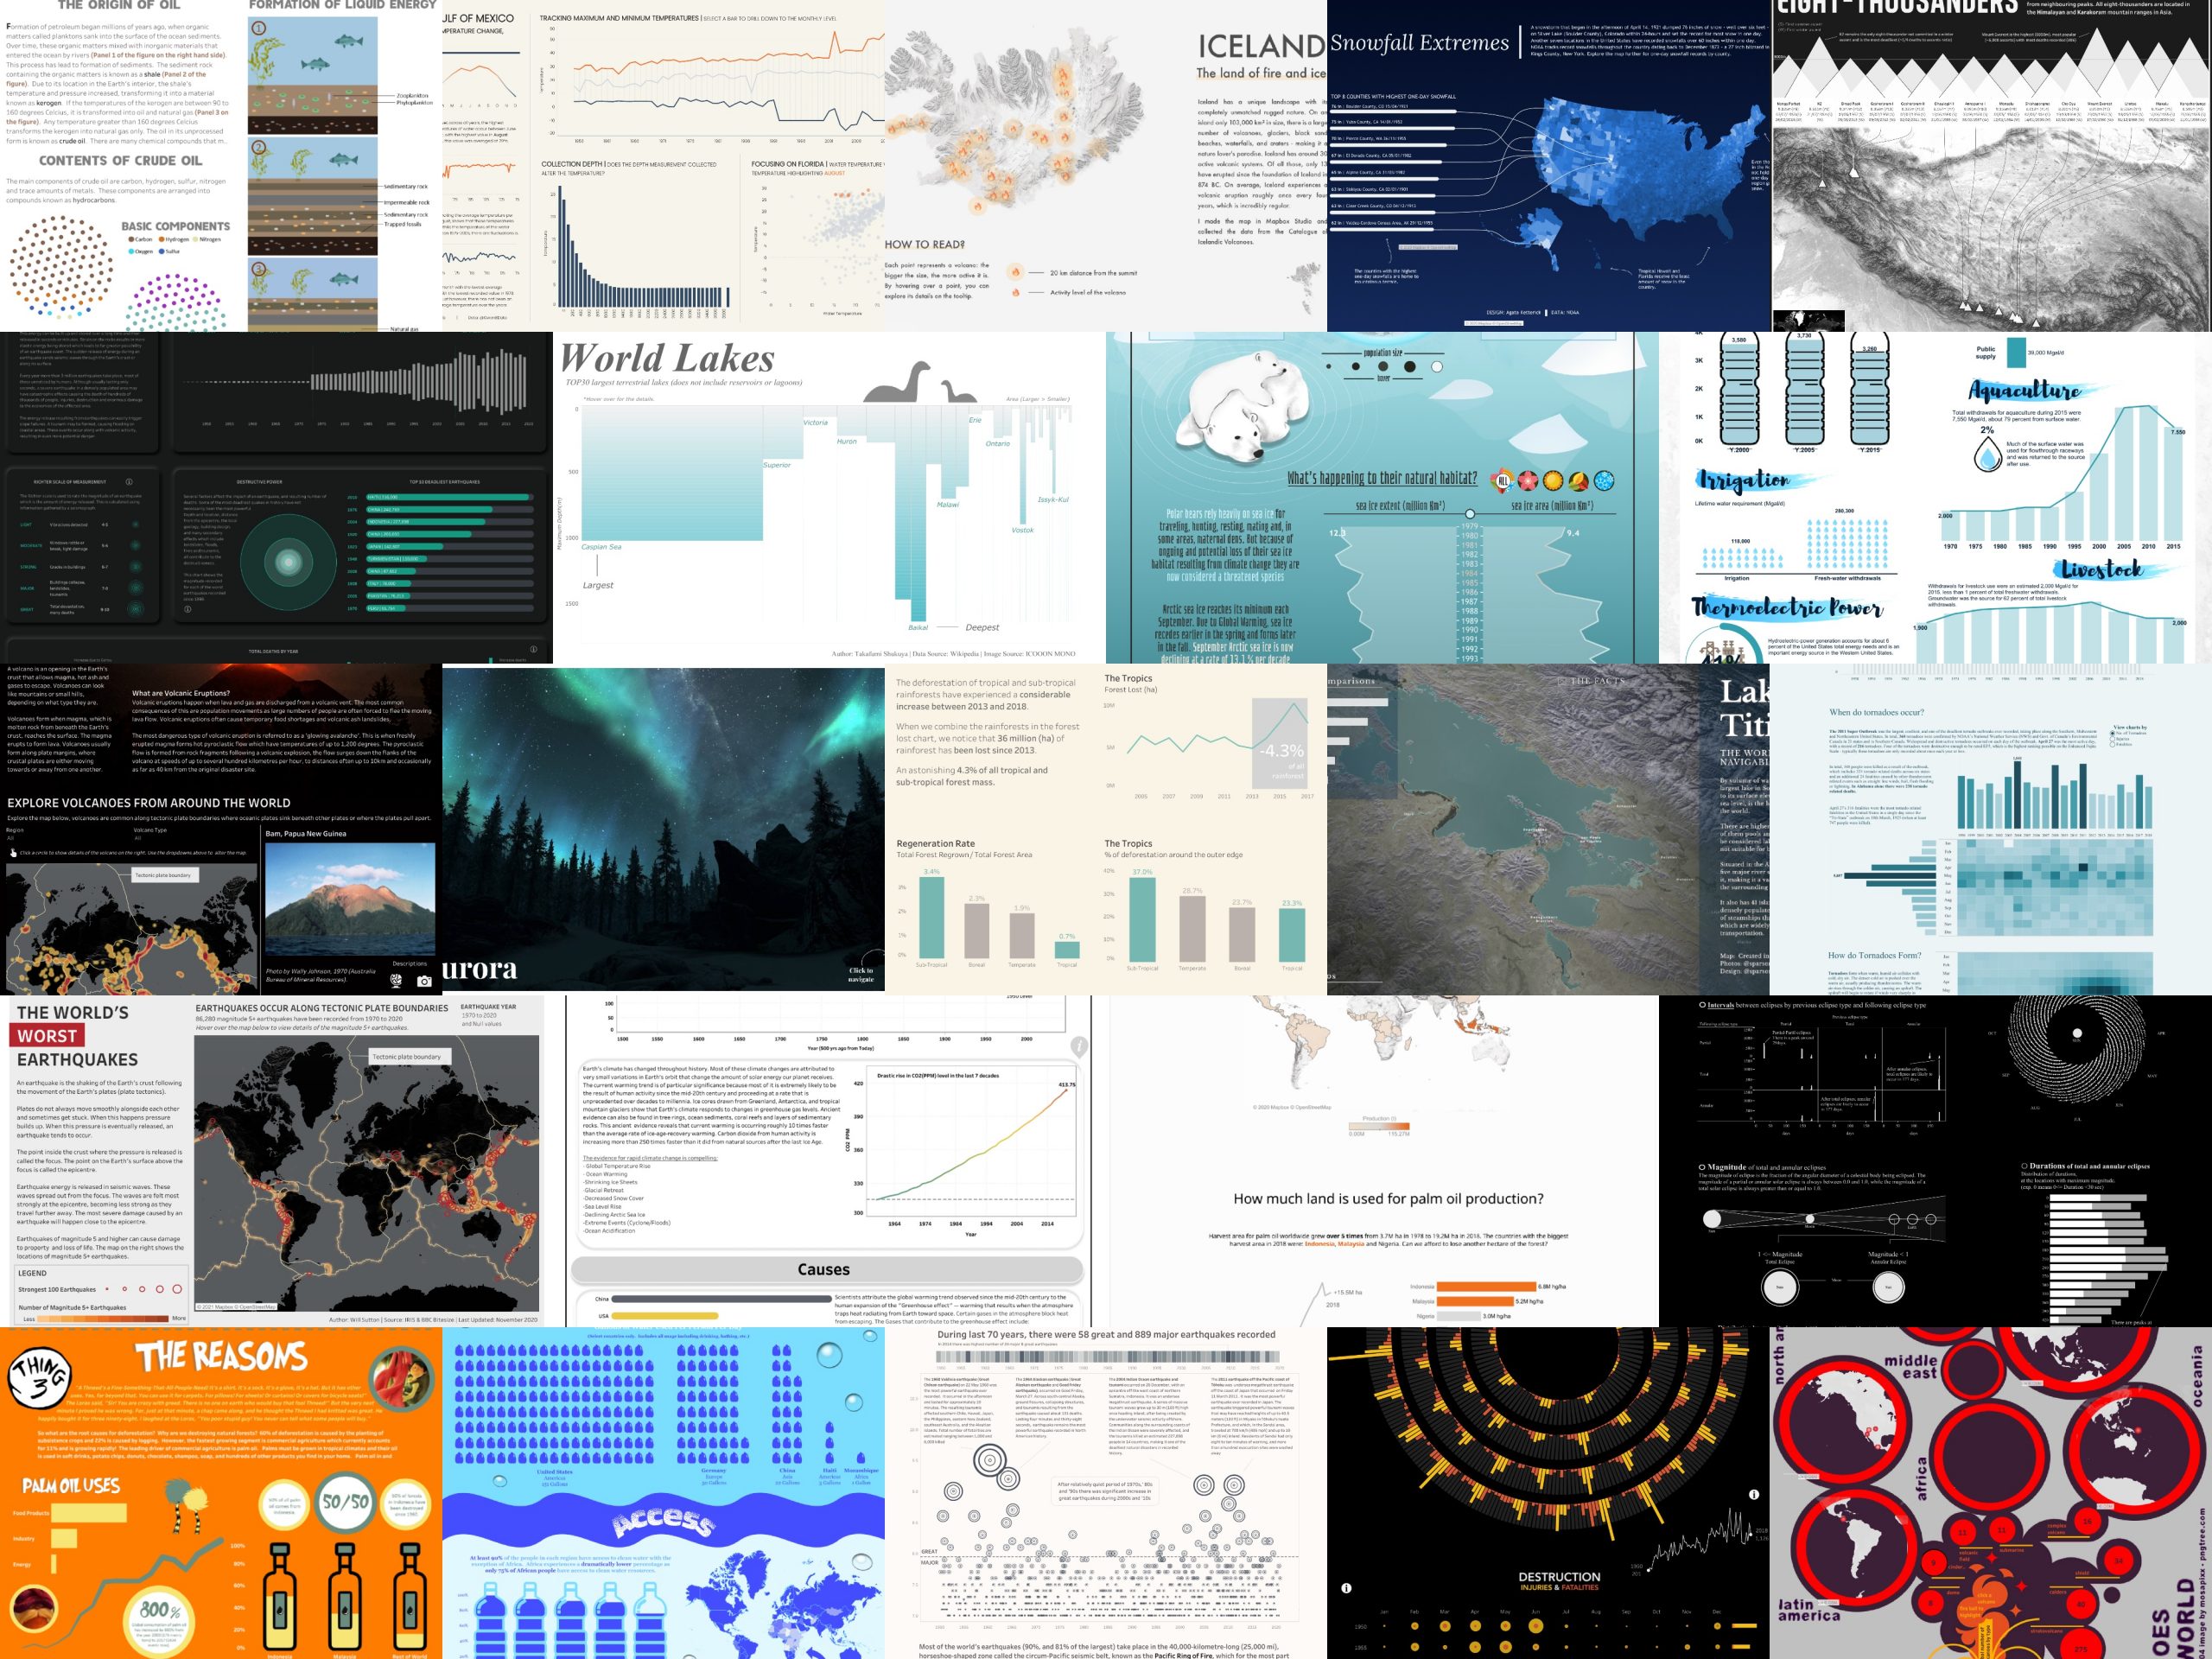
Despite this month’s topic being ‘Geography’, due to the freedom around possible sub-topics we have seen a wide variety of entries. Personally, we have been blown away by the range of different designs and approaches that have been used to deliver impactful and inspiring stories. Due to the high volume of entries this month, we thought we would highlight some of the entries that particularly stood out to me!
The first entry we would like to highlight is Monika Jaworska’s World Got Hooked on Palm Oil. One reason why we particularly loved this entry is because it highlights a topic that is going to be at the forefront of education for the young people of today. Monika uses a simple and clean design to effectively create a powerful and compelling story.
The changing habitat of Polar Bears by George Koursaros is another favourite – this viz was awarded a VOTD and we’re not surprised! The fun and modern design serves as a stark contrast to the serious subject matter of the plight of the polar bear and global warming. The style of the design not only makes this Viz engaging, but also makes it accessible for people of all ages!
Petroleum Microbiology by Young Song genuinely looks like it has just jumped out of the coolest geography textbook ever! It’s packed with information not only making it an ideal supporting resource for teachers to use alongside the set syllabus, but also ideal for those students who have limited access to expensive textbooks.
We had some awesome vizzes on Earthquakes this month. Major & Great Earthquakes 1950-2020 by Mateusz Karmalski really stood out to us for it’s simple black and white colour scheme and clean layout, making it easy to read and interpret – perfect for the intended student audience! A wonderful addition to the gallery. Earthquakes Recorded between 1898 to 2019 by Naresh Suglani is another example of impressive slick design. Naresh’s visualizations seem to get better by the hour, and in our view have not yet received enough recognition. We are really honored to have one as part of the #Viz2educate gallery and know that students are going to be blown away!
Tornados have also proved to be a winning topic. Tornado by Kevin Flerlage makes use of a whirling radial bar chart which is a treat to dive into and will hopefully help spark young minds. Eve Thomas’s Terrifying Tornados received a VOTD. Taking a more informative approach, it discusses the science behind how tornadoes form, and when they are likely to occur.
Finally, this list would not be complete without mentioning Kevin Flerlage’s The Lorax. In this visualization Kevin uses one of Dr. Suess’ best loved characters to discuss the devastating impact of deforestation on our planet. For us, this viz is a brilliant example of a design which engages and inspires both older and younger audiences alike (and coming from a background in teaching, Eve can tell you that it’s just as important to inspire the worlds teacher’s as well as their students!). This will be an invaluable addition to the #Viz2educate gallery – Thank you Kevin!
Here is the link to our Geography viz gallery
All the entries we received this month were awesome and will hopefully help towards our goal of empowering teachers across the globe. Again, we would both like to thank everyone in the #datafam who contributed to this month’s topic – we are looking forward to seeing what you can produce for our next topic!
By Eve Thomas and Vinodh Kumar