This month for #Viz2educate we chose the subject of History. We asked you to create visualizations not only to aid teachers across the globe but to inspire their students, and we’ve been overwhelmed by the incredible submissions we’ve received this month from the #datafam community!
In total, we received 23 submissions for History – below are some of the vizzes that really stood out to us this month!
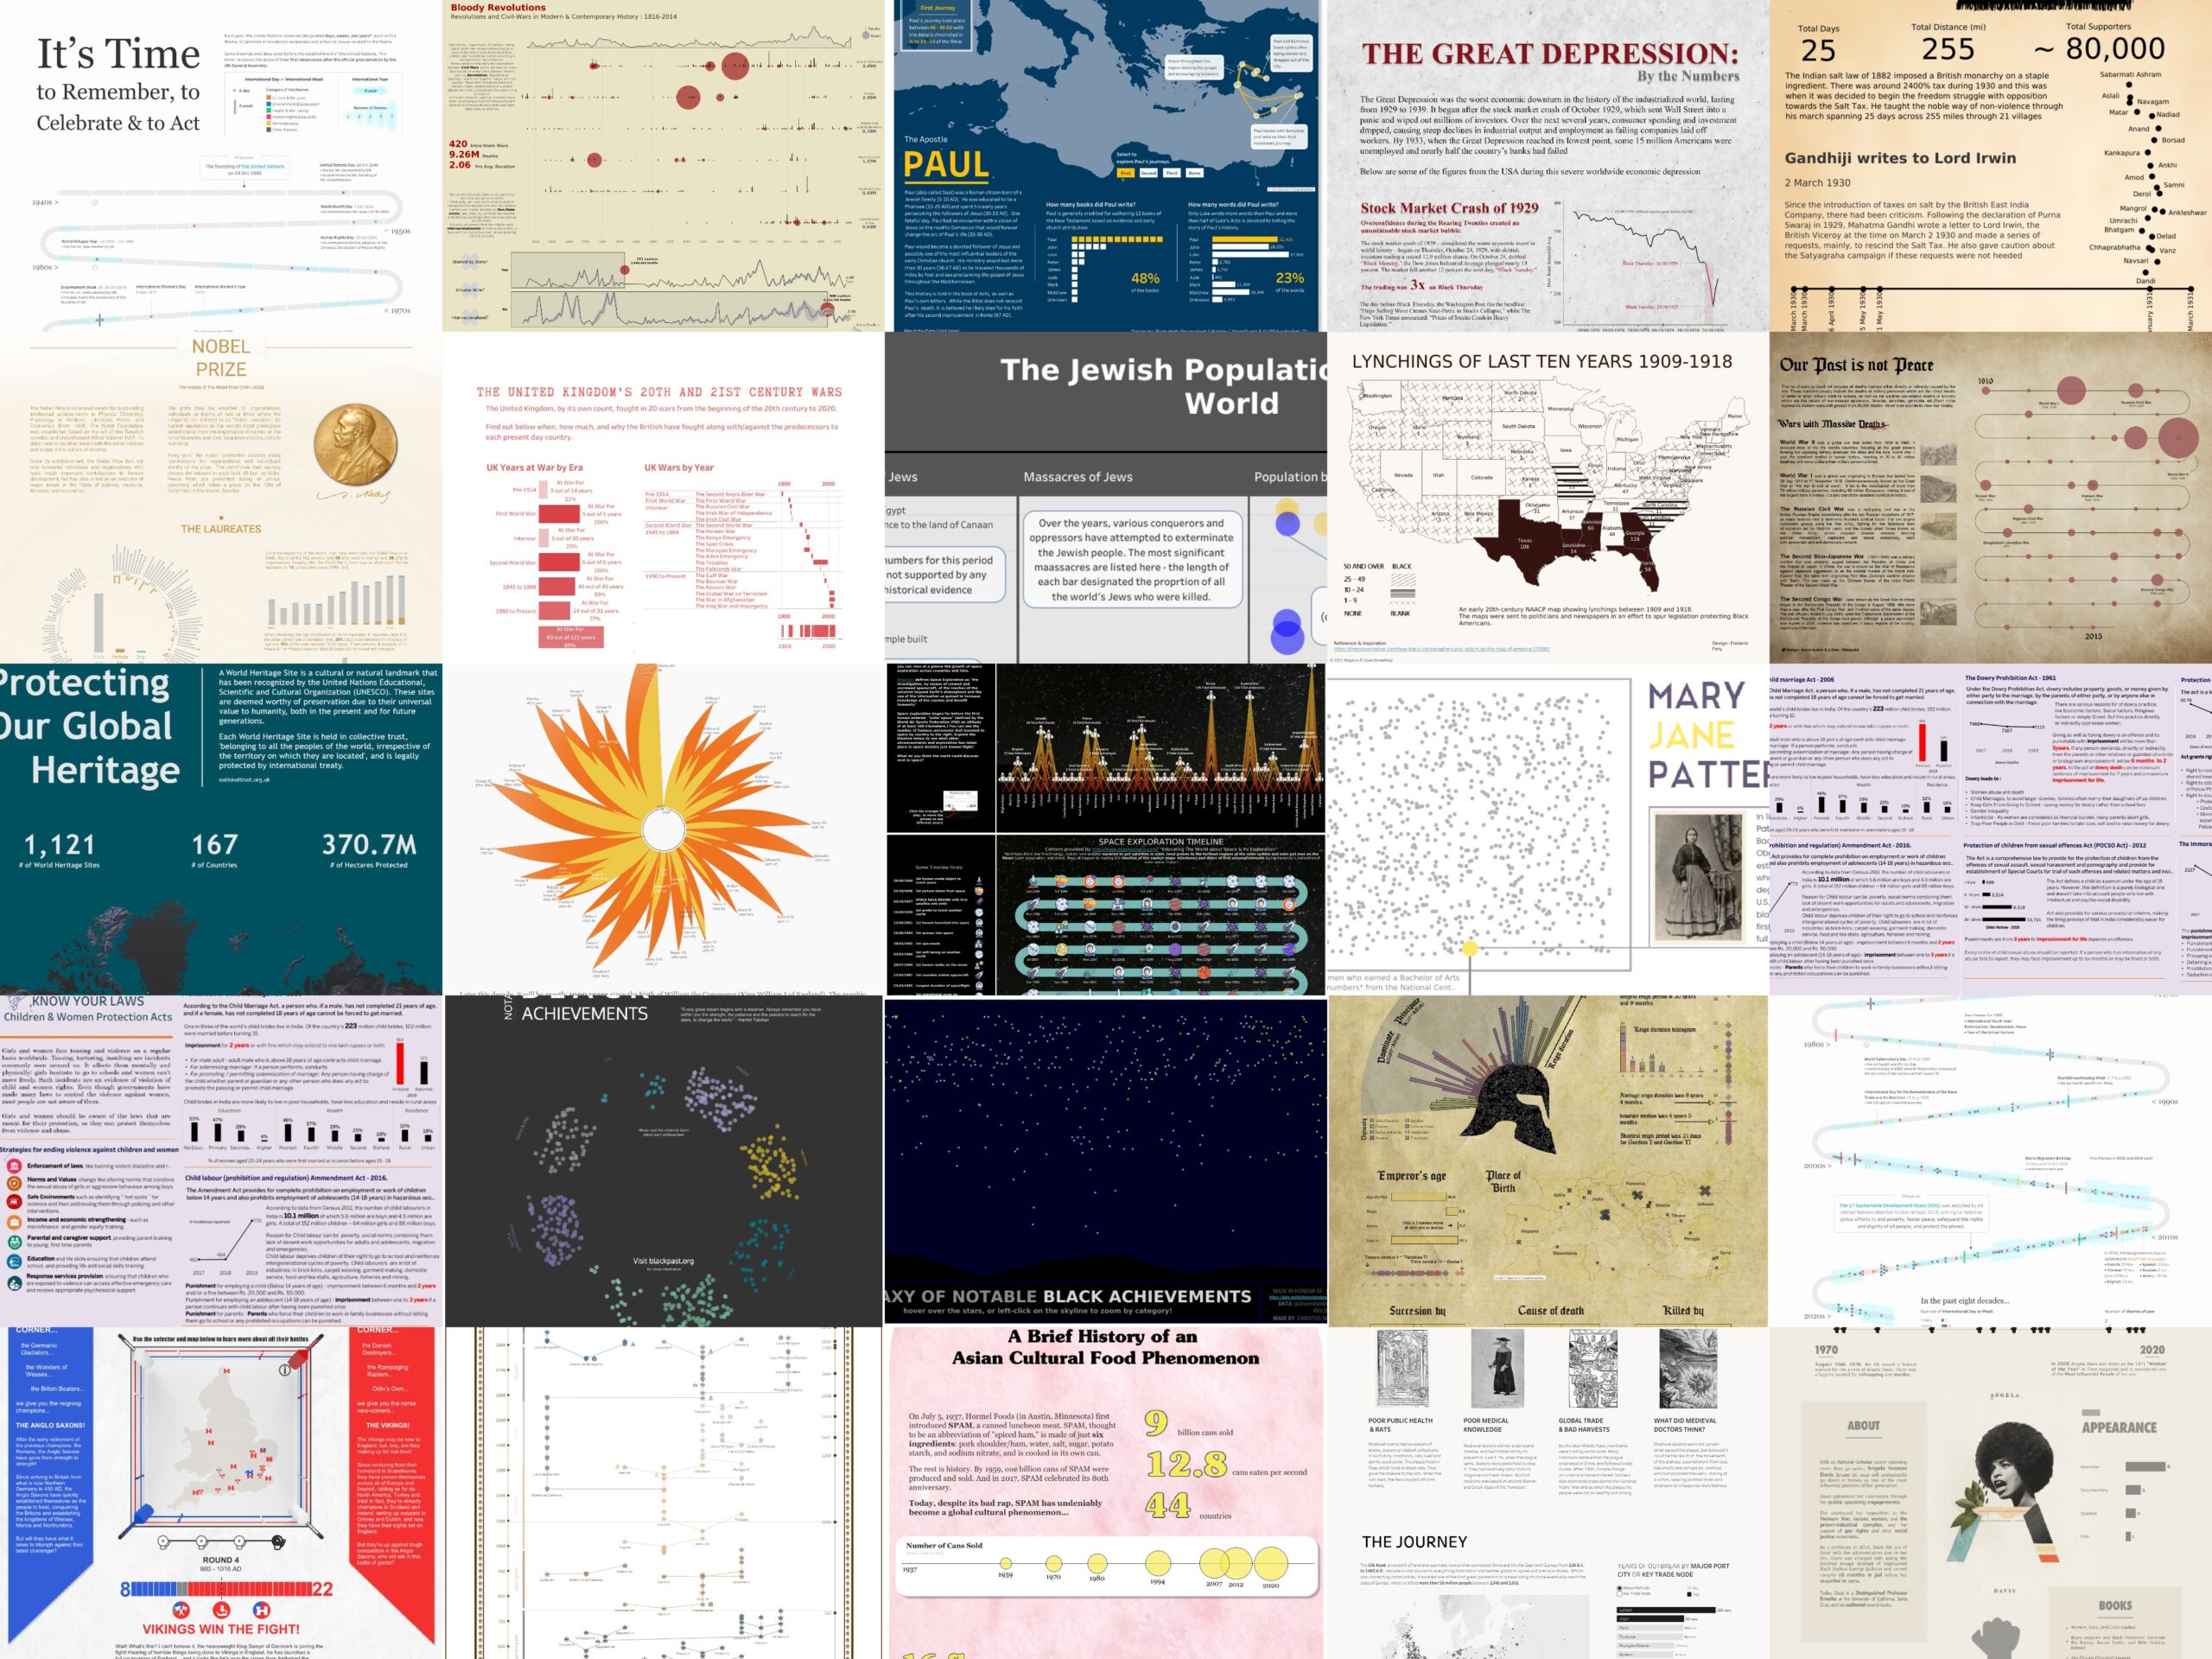
The first viz I would like to highlight is Fred Najjar’s History of the Nobel Prize. We loved Fred’s simple colour scheme and clean layout as well as his fun use of a radial chart highlighting prizes by gender and organisations over time. It’s packed with information not only making it an ideal resource for teachers, but also ideal for those students who have limited access to expensive textbooks.
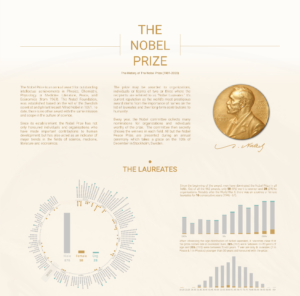
Mateusz Karmalski’s Roman Emporers viz also stood out to me for its fun and modern design. The design not only makes this Viz engaging, but also makes it accessible for people of all ages!
The Black Death by Alisha Dhillon is a classic example of incredible storytelling and clear narrative – we love Alisha’s simple use of colour and her well thought out chart choices – we believe this will be a great resource for students.

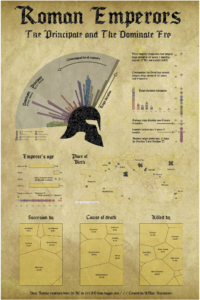
We love this fun entry Anglo Saxons Vs The Vikings from Mark Corbridge – The bright colours and simple design make this engaging and easy to explore for our target student audience.
Our Past is not Peace by Kavin Kumar G highlights the world’s most deadly conflicts since 1910. The clear narrative and rich content make this an amazing addition to our resource gallery.

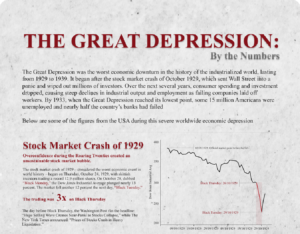
The Great Depression by Aman Gulati is another example of using clean and simple design to tell a powerful narrative. I love the chart annotations and the use of one contrasting colour to highlight key historical events to the user.
Finally, we have had some amazing visualizations that highlight key individuals that have changed the course of history.
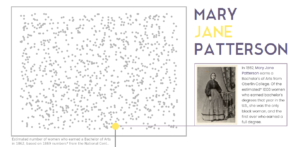
Mary Jane Patterson by Bechor Barouch tells the incredible story of Mary Jane Patterson, who overcame all obstacles to become the first Black woman to receive a B.A Degree in 1862. We love Bechor’s use of a timeline to guide the user through key events of Mary’s life.
Angela Davis: The Activist Queen by Olushola Olojo highlights the inspiring life-work of Angela Davis, an American political activist, philosopher, academic and author. Olushola’s slick design makes this viz engaging for users of all ages – a fantastic addition to our resources gallery!

We have received some incredible entries this month which will help towards our goal of empowering teachers across the globe. Again, Vinodh and I would like to thank everyone in the #datafam who contributed to this month’s topic – we are looking forward to seeing what you can produce for our next topic of Arts and Music!
Please find the link to history gallery here : Link
-Eve Thomas & Vinodh